We have a
special site for this eclipse!
Our coverage of the total solar eclipse of August 21, 2017, with detailed path descriptions, viewing circumstances, and weather prospects.
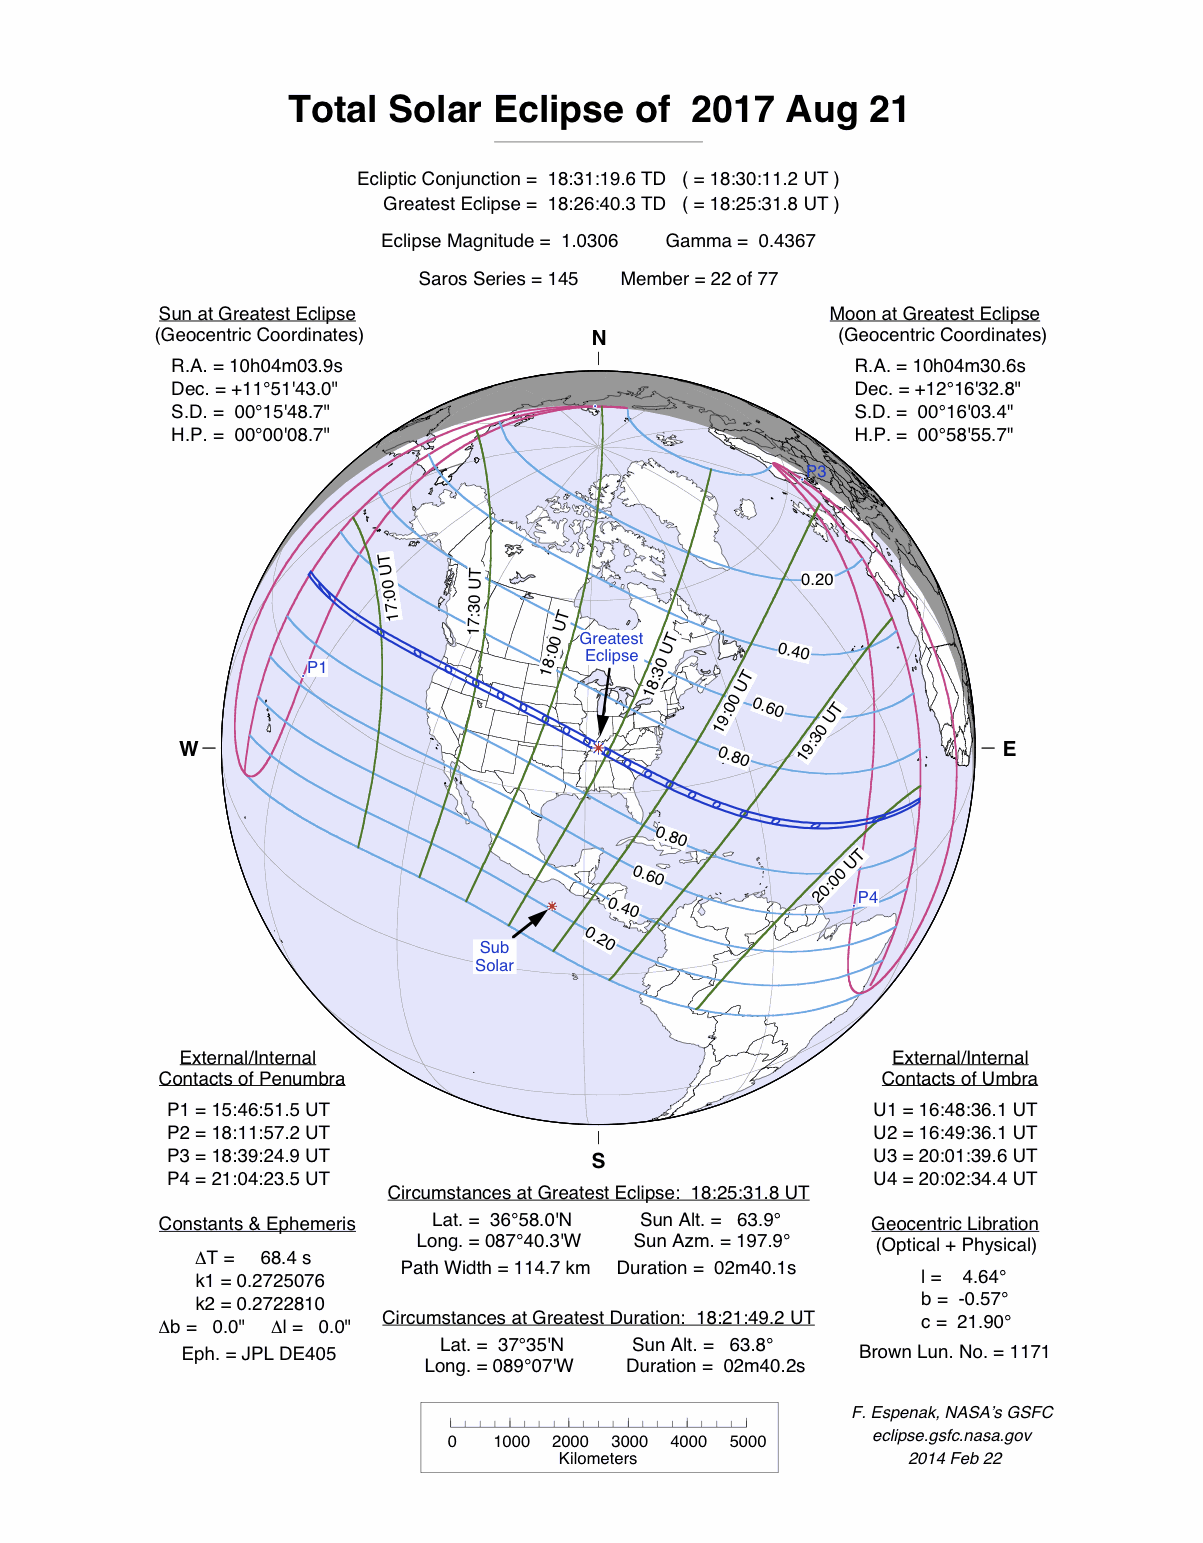
A total eclipse of the Sun occurred on Monday 21 August, 2017 UT, lasting from 15:46–21:04 UT. A dramatic total eclipse plunged the Sun into darkness for 2 minutes and 40 seconds at maximum, creating an amazing spectacle for observers in a path up to 115 km wide. It was seen across the central US. The partial eclipse was visible from the whole of North America, northern South America, and western Europe and Africa.
The timings of the phases of the overall eclipse
worldwide are as follows. In any particular
place it would have been seen for a significantly shorter
duration as the shadow moved across the Earth:
| Partial eclipse began: |
15:46:51 UT |
| Total eclipse began: |
16:48:36 UT |
| Maximum eclipse: |
18:25:32 UT |
| Total eclipse ended: |
20:02:34 UT |
| Partial eclipse ended: |
21:04:24 UT |
During this eclipse the Sun was 0.527° in apparent
diameter, 1.1% smaller than average. The Moon was just 3 days past perigee, making it relatively large.
At the start and end of the eclipse the Moon
was 0.535°, and at maximum eclipse 0.543°,
which is 2.3% larger than average; hence it covered the Sun,
making this a total eclipse.
The statistics page has information on the ranges of the sizes of
the Sun and Moon, and the Moon data page displays detailed
information on the Moon's key dates.
This will be visible as a spectacular total eclipse to millions of people in Oregon, Idaho, Wyoming, Nebraska, the north-east corner of Kansas, Missouri, southern Illinois, Kentucky, Tennessee, north-east Georgia, and the Carolinas.
Western USA
The path starts in the Pacific well north of Hawaii at 16:48 UT, and then crosses to make landfall in the northern half of Oregon at 17:17 UT. The line of maximum eclipse hits the coast just south of Lincoln City; the path is 99 km (61.5 miles) wide here, so residents of Portland would be well advised to make the short trip south to the centreline, where the eclipse will last 1 minute 59 seconds (although getting inland away from the clouds may also be a good idea).
The eclipse then passes into Idaho and Wyoming, and enters Nebraska about 17:48 UT. The path width is up to 110 km (68.4 miles) here, and the duration on the centreline is 2 minutes 29 seconds.
Eastern USA
The path of totality then clips the north-east corner of Kansas about 18:06 UT; it passes just north of Kansas City and crosses Missouri, where St. Louis is unluckily just north of the path. The centreline passes De Soto, just south of the city, at 18:18 UT, so the residents would be well advised to make a trip south for the day to see 2 minutes and 40 seconds of total eclipse.
The path then crosses the southern end of Illinois, passing just south of Carbondale at about 18:21 UT. Seven years later, the total eclipse of April 8, 2024 crosses the same spot; part of the incredible USA eclipse bonanza.
The eclipse is very close to maximum here, and in fact reaches maximum at 18:25 UT, in western Kentucky near Princeton. At this point the total eclipse will cover a path 115 km (71.5 miles) wide, and will last 2 minutes and 40 seconds on the centreline.
After maximum, the path of totality moves on southeast across Tennessee, and then clips North Carolina and Georgia before moving into South Carolina. Observers in Georgia will have to get into the very north-east corner of the state to be close to the centre of the eclipse, which will be there at 18:37 UT, with totality lasting 2 minutes 38 seconds.
The path of totality crosses South Carolina and reaches the ocean just north of Charleston, at 18:48 UT. The duration of the total eclipse will still be 2 minutes 33 seconds on the centreline, so it is still a spectacular eclipse — if the sky is clear; the path of totality is 115 km (71.5 miles) wide.
Interactive Map
This map shows the visibility of the eclipse.
The shaded area saw the total solar eclipse; however, near the edges of
this area, the eclipse was very short. The bold line shows the centre
of the path, where the eclipse lasted longest.
Use the zoom controls to zoom in and out; hover your mouse over any
point on the centreline to see the time and
duration of the eclipse at that point. You can pan and zoom the map to
see detail for any part of the eclipse path.
The interactive map is currently not available.
Overview Map
This map sourced from NASA Goddard Space flight Center: GSFC Eclipse Web SiteGSFC Eclipse Web Site
The primary source of all the information on eclipses presented here at Hermit Eclipse. (NASA Goddard Space flight Center)
shows the visibility of the total solar eclipse. It also shows the broader area in which a partial eclipse was seen. (Click on it for the
full-sized version.)
Eclipse Season and Saros Series
This eclipse season contains 2 eclipses:
This was the 22nd eclipse in solar Saros series 145.The surrounding eclipses in this Saros series are:
This Saros series, solar Saros series 145,
is linked to lunar Saros series 138. The
nearest partner eclipses in that series are:
Eclipse Parameters
| UT Date/time (max) | 18:25:30 on 21 Aug UT |
TDT Date/time (max) | 18:26:40 on 21 Aug TDT |
| Saros Series | 145 |
Number in Series | 22 |
| Penumbral Magnitiude | |
Central Magnitiude | 1.0306 |
| Gamma | 0.4367 |
Path Width (km) | 115 |
| Delta T | 1m10s |
Error | ± 0m04s (95%) |
| Penumbral Duration | |
Partial Duration | |
| Total Duration | 2m40s |
| |
| Partial Rating | major |
Total Rating | major |
| Sun Distance | 151323968 km (87.5%) |
Moon Distance | 372108 km (31.2%) |
| Sun Diameter | 0.527° |
Moon Diameter | 0.535° - 0.543° |
| Perigee | 13:15 on 18 Aug UT |
Apogee | 11:26 on 30 Aug UT |
| Contact p1 | 15:46:51 on 21 Aug UT |
Contact p2 | |
| Contact u1 | 16:48:36 on 21 Aug UT |
Contact u2 | 16:49:36 on 21 Aug UT |
| Max eclipse | 18:25:32 on 21 Aug UT |
| Contact u3 | 20:01:40 on 21 Aug UT |
Contact u4 | 20:02:34 on 21 Aug UT |
| Contact p3 | |
Contact p4 | 21:04:24 on 21 Aug UT |
Note that while all dates and times on this site (except
where noted) are in UT, which is within a second of civil time,
the dates and times shown in NASA's eclipse listingsGSFC Eclipse Web Site
The primary source of all the information on eclipses presented here at Hermit Eclipse. (NASA Goddard Space flight Center)
are in the TDT timescale.
The Sun and Moon distances are shown in km, and as a
percentage of their minimum - maximum distances; hence 0%
is the closest possible (Earth's perihelion, or the
Moon's closest possible perigee) and 100% is
the farthest (aphelion, the farthest apogee).
The statistics page has information on the ranges of sizes
of the Sun and Moon, and the Moon data page displays detailed
information on the Moon's key dates.
Data last updated: 2015-06-21 22:11:46 UTC.