This page describes the main features of FracTest's user interface.
The fractal window is the main part of the FracTest user interface. It is where the fractal is displayed; it is also where you can use selections to pick part of the view to zoom in on, and where you can drag and drop PNG files to load them for rendering, or to add them to a batch mode work queue.
When you first start FracTest, it will typically display a default Fractal view; if you have not added any compute servers, though, it might stay blank. Once you start exploring, it will display the current fractal view as it is computed.
The fractal window is as large as it can be to fit in the application window. However, the shape of the fractal view shown in it depends on the image size setting in the view controls.
The generated fractal image will always be the selected size. The image will be scaled up or down, as needed, to fit in the fractal window; but the image saved to a file will always be the full-sized image.
Resizing the window has no effect on an ongoing computation; the fractal view will simply be scaled to the new window size.
While a fractal is being computed, the window will show the fractal developing. In progressive mode, you will see the fractal rendered roughly at first, then fill in with more detail. Boxes drawn over the fractal will show which tiles are being worked on, coloured to show which pass is currently being computed. There should be as many tiles being computed at once as your computer has logical processors.
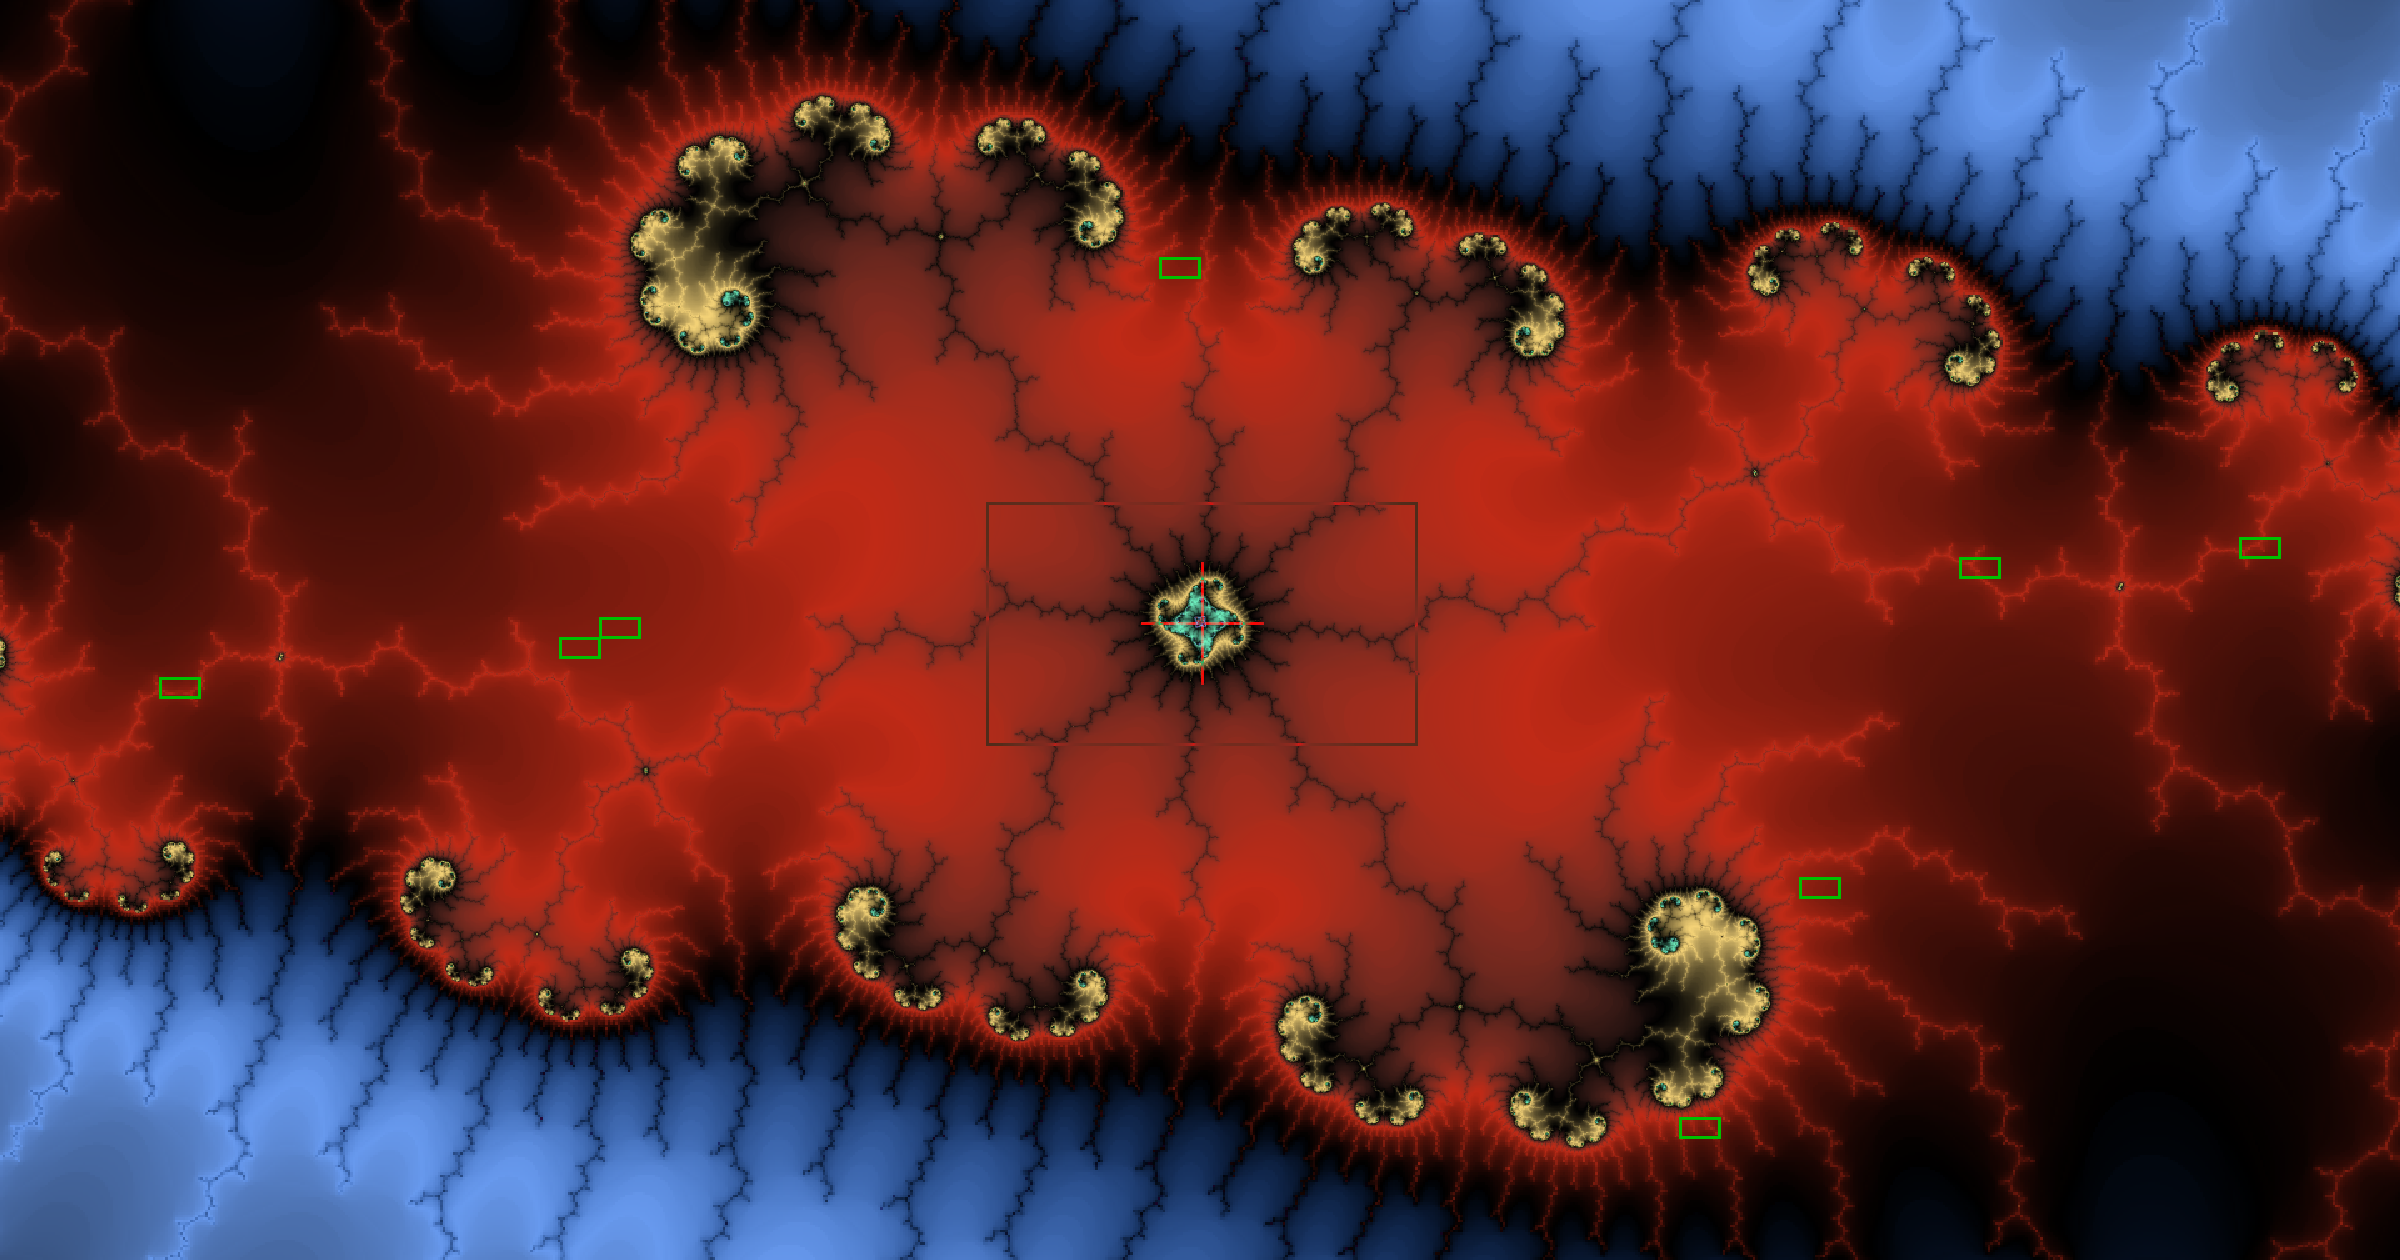
You can make a selection by clicking and dragging with the mouse in the fractal window. Your selection will be shown as a box with a central cross, as in the picture above. While you are dragging, you will notice that the aspect ratio is constrained to be the same as the fractal window; the selection box shows exactly what part of the fractal will be rendered if you click "Play" (see below). The cross in the centre selects a single point, which is used for some features such as point analysis.
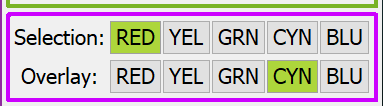
Once a selection is made, you can move it by dragging within it using the mouse. You can also adjust it more finely using the keyboard — arrow keys move the selection a pixel at a time, and the Page Up and Page Down keys expand and shrink it. To help keep the selection visible against many-coloured fractal images, you can change the selection colour in the selection display control panel.
With a selection made, rendering the fractal will render the selected area. This is normally done with the "Play" button, but any feature which triggers a render (such as the quick-access buttons for palette shift) will also render the selected area.
You can drag and drop PNG files which were previously saved from FracTest from your computer into the fractal window.
In regular interactive mode, you can drop a single file into the window; that file will then be rendered according to its saved parameters. Of course, you can stop it, adjust the parameters, zoom, etc., to create any derived view you want. This is the same as the "Open" action in the toolbar.
In batch mode, you can drop multiple files into the window at a time. Rather than being rendered immediately, these will be added to the batch mode work queue; they will eventually be rendered according to their saved parameters, as overridden by the batch mode command line, and saved.
Bear in mind that there's no point in dropping other files — including PNG files from other apps, or JPEG files — into FracTest; only FracTest's own PNG files, with embedded fractal parameters, can be processed by FracTest.
The toolbar occupies the left-hand half of the strip across the top of the screen, below the menu bar. The name of the current session is displayed boxed below the toolbar. The image title field is to the right of this, but will be blank if there is no image title:

The toolbar provides quick access to the most commonly-used features of FracTest:
|
|
Open a file, load parameters for a fractal view from it, and render that view. Currently FracTest stores its view parameters as meta-data in PNG files, and so this function is only useful to load a PNG file which has been created by FracTest. |
|
Save a view to a PNG file. Use this to save the master copy of a fractal view; or to bookmark a view for later study; or to save a palette you like. Even if the view is only partly rendered, the fractal parameters will be saved so that you can come back to this view later. |
|
|
Export a view to a Jpeg file. This only saves the image of the view — no parameters are saved. Use this to export a smaller, faster image file; for example for web sharing. |
|
Open the FracTest settings window. |
|
|
Go to the home view for the current fractal. This is basically the fully zoomed-out view that shows the whole fractal. |
|
Go back to the first view in the history. This will be greyed out if you are already at the first view. |
|
|
Go back to the previous view in the history. This will be greyed out if you are already at the first view. |
|
Go forwards to the next view in the history. This will be greyed out if you are already at the last view. |
|
|
Go forwards to the last view in the history. This will be greyed out if you are already at the last view. |
|
Open the history window. |
|
|
Zoom in. Currently zooms in at the centre of the image by 5:1. |
|
Zoom out. Currently zooms out at the centre of the image by 5:1. |
|
|
Render the current view parameters. If a render is currently running, it is aborted; then a new render is started with the current parameters. Use this after adjusting the parameters in the control panel, or after selecting an area with the mouse, to actually render it. |
|
Stop the current render. |
|
|
Show the containment tree of all views in the context database. |
|
Toggle the overlay of contextual views on top of the current view. |
|
|
When you have an active selection, the point at the crosshairs of the selection can be analysed by clicking this button. This feature is under-developed and pretty well borken at the moment. |
|
When you have an active selection, the area within the selection can be analysed by clicking this button. This feature is currently experimental. |
Note that the history is persistent, so navigating back and forth in it is very fast; each time you go back or forwards, the corresponding view is re-opened and continues rendering from where it left off, rather than having to start from scratch.
The menu bar is essentially self-explanatory, and contains all of the commands which are on the tool bar. However there are some extra, less frequently-used features there:
| File | Open Session | Pops up the session chooser, allowing the user to manage sessions, or open a new session. |
| Palette | Load Palette | Loads a palette from a PNG file. Use this to load just the palette, not the other view parameters, from a PNG file that was created by FracTest. |
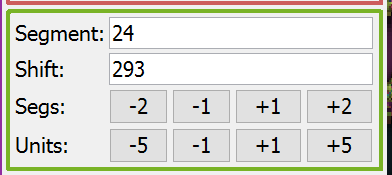
| Palette | Capture Palette | This command captures part of the current palette into a new palette. Enter the offset and size, in segments, of the colours you want to capture, and a new "User" palette will be created containing those colours. |
| Generate | Map to Here | Creates an image sequence illustrating the location of the current view within the overall fractal. Although the individual thumbnails are small, this can take a very long time on deeply nested images. |
| Work | Manage Work Queue | Brings up the Queue Management window, which will show all jobs currently queued. Normally empty, this is useful in batch mode, or other situations where fractal renders are queued, such as Map to Here. |
| Work | Manage Cluster | Brings up the Cluster Management window, which displays the status of every server known to FracTest. Even in standalone mode, FracTest uses a server for computation, so this is potentially useful in all cases. |
| Help | Manual: ... | Links to the sections of the user's manual (this document). |
| Help | About | Shows the about box. |
The image title field is below the toolbar, and displays the title of the current image. This is set when it is saved to a file. If you depart significantly from the named view, this field is blanked to show that you are no longer on that view. If there is no title, the field will be blank.
The information panel occupies the right-hand half of the strip across the top of the screen, below the menu bar and to the right of the toolbar.
This panel contains numerous useful pieces of information. It looks like this:

At the top-left is the resolution indicator. This displays the arithmetic mode currently in use, the number of bits of precision required to compute the current view, and the percentage of the available precision which has been used. If the Math Mode is set manually, this indicator will change colour to warn you when you have zoomed too deep for the current mode. If the Math Mode mode is "AUTO", then don't worry even if it goes red at 100% — the mode will change automatically as you zoom deeper.
To the right of this is the time indicator. This shows the current state of the computation — blue indicates that a computation is running, green is complete, and other colours indicate various exceptional states. While a computation is running, and after a little time has elapsed, this panel will display an estimate of the Time To Go (TTG), abbreviated as seconds ("s"), minutes ("m"), hours ("h"), or days ("d") as appropriate. It will also show the Estimated Time of Arrival (ETA); since this only shows the time, remember to add the number of days indicated in the TTG. Once a render has completed, this shows the time of day at which it finished, and the length of time it took.
Below these is the "factoids box". It shows:
The co-ordinates panel displays and inputs the co-ordinates of the current view, and the current selection.
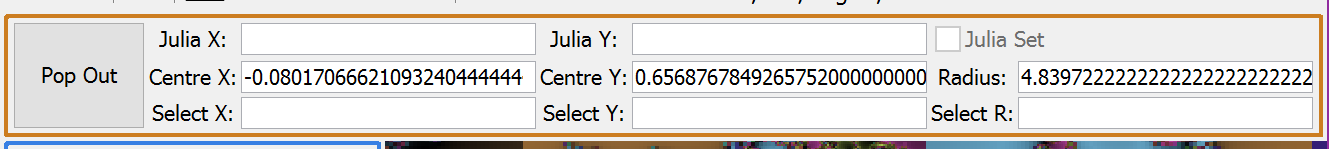
The middle row displays the essential co-ordinates and radius of the current view. Above that, for Julia set views, are the co-ordinates of the Julia set reference point; the checkbox puts FracTest into Julia set mode.
The bottom row displays and sets the selection position — the X and Y are the crosshair position, and R is the size of the box around it. You can use this to see the exact position of a point you select on screen. If you want to select a specific point, start a selection by dragging in the fractal window, and then adjust the co-ordinates here.
In deeply zoomed views, the co-ordinates will be too large to see and edit here. The "Pop Out" button on the left pops the co-ordinate fields out into a separate window, with much larger text fields. Closing that window pops the panel back in again.

| Fractal: | The fractal to render. FracTest is capable of supporting multiple fractals, but in practice the focus has been heavily on Mandelbrot, so there are as yet few others. |
| Rep Func: | The representation function to use to display pixel values. "D" is the standard dwell time, or escape time; "T" is tuning; and "BD" is the binary decomposition of the external angle. These can be enabled in any combination, but at least one must always be set. Note that "BD" mode requires careful setting of the bailout value. |
| Math Mode: | The mathematics mode to use. AUTO will select the mode and precision to use automatically, based on the current zoom level, resolution, and anti-aliasing. |
| Precision: | If the math mode is FX (Fixed), this setting determines how many words of precision to use. Otherwise, it is ignored. |
| Iterations: | The number of iterations to run on each pixel before it will be considered part of the fractal set (if it doesn't reach the bailout value). |
| Bailout: | The bailout value. 2.0 is strictly correct (for the Mandelbrot set); however, larger values (e.g. 4.0) can help to reduce visible banding, particularly near the outer edges of the set. |
| Image: | Sets the size of the image to generate; the image will be scaled to fit the window for display, but will be saved to disk at the specified size. |
| Progressive: | Sets the progressive rendering mode. "No" turns progressive rendering off; the other modes will render in multiple passes, with a rough image of the view appearing relatively quickly. |
| AA: | Sets the anti-aliasing mode. |
| Cycles: | Turns cycle detection on or off. Cycle detection uses
Brent's algorithmCycle Detection; Brent's algorithm Article on cycle detection by Brent's algorithm. (Wikipedia) https://en.wikipedia.org/wiki/Cycle_detection#Brent's_algorithm. This is quite efficient, and should add little overhead to a calculation; however, if there is any significant amount of black in the image, cycle detection will cause those pixels to terminate early, saving a large amount of computation. Generally turn this on if there is much black about. |
| Smoothing: | Turn this on to smooth out the banding that occurs in open areas. Turn it off if you wish to see the results of the iteration counting directly; otherwise leave it on, as the overhead is very small. |
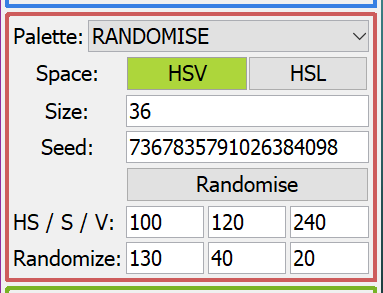
The one control which is always present is the "Palette:" selector at the
top; this allows the type of palette in use to be selected.

The aim is to give you a subjective indication of how light or dark your image is.
With non-progressive rendering, each tile will turn green as it is rendered — when all are green, the fractal is finished.
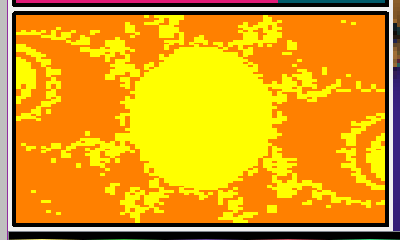
With progressive rendering, each tile is coloured to indicate how many passes it has completed, green being the last pass. Hence, the progress panel is a 2-D map of the progress through the computation.
The example at right shows a fractal which has completed the third-last pass (orange) and is working through the second-last pass (yellow). Since slowest tiles are rendered first after the last pass, we can see here that the central circle and the spirals branching from it are the most processor-intensive to render.